
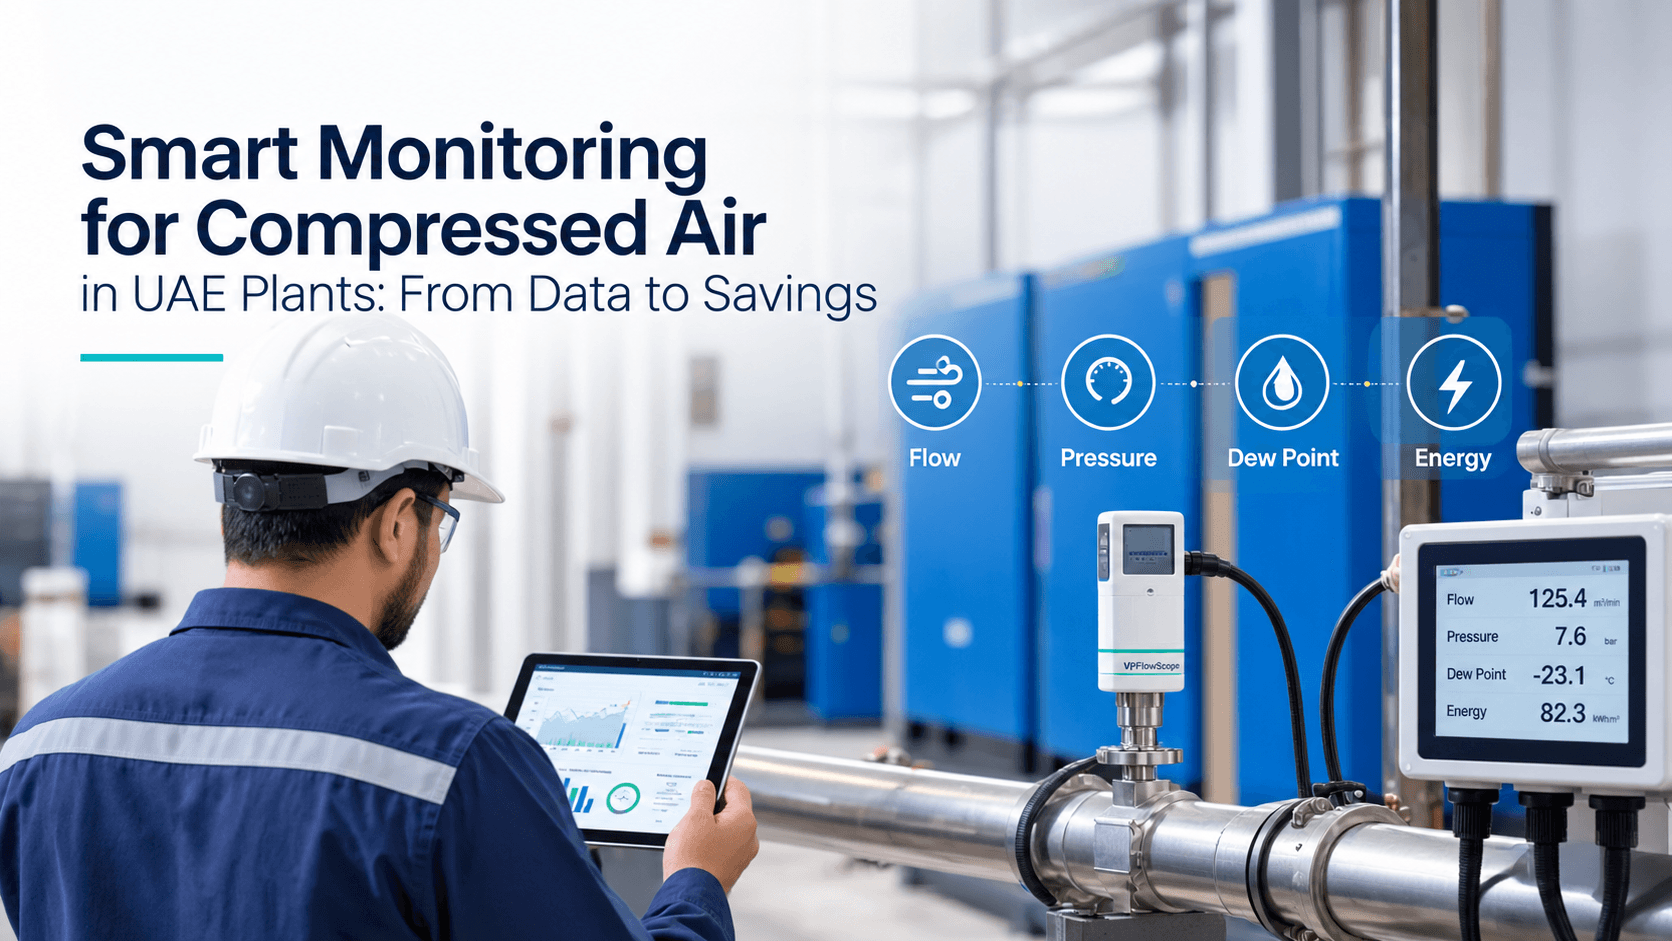
Smart Monitoring for Compressed Air in UAE Plants: From Data to Savings
Walk into most compressor rooms in a UAE manufacturing facility and you will find the same setup: a gauge on the wall, a logbook filled in once a shift, and a maintenance team that responds to faults rather than anticipating them. The compressor runs, the pressure looks acceptable, and nobody is quite sure how much of the air produced actually reaches production equipment rather than escaping through leaks or pressure drop along the way.
This is not negligence. It is a data problem. Without continuous measurement of flow, pressure, dew point, and energy consumption, there is no reliable way to know whether a compressed air system is performing efficiently or quietly wasting a significant fraction of its electricity budget. The only way to manage compressed air costs is to measure compressed air performance, and the technology to do that affordably is now widely available.
CHS installs CS Instruments and VP Instruments IoT monitoring systems across UAE industrial facilities, from food processing plants in Abu Dhabi's ICAD zone to fabrication shops in Sharjah and packaging lines in Dubai's industrial areas. In almost every case, the first weeks of monitoring data reveal something the facility team did not expect.
10-30%
Typical energy reduction from measurement-led compressed air optimisation. Source: Compressed Air Challenge, Fundamentals of Compressed Air Systems (US DOE / EERE partner publication).
What a Monitoring System Actually Measures
A full compressed air monitoring installation combines four instrument types, each measuring a different dimension of system performance. Together, they give a complete picture of what the compressor is producing, how the distribution network is handling it, and whether the treatment equipment is doing its job.
Flow at the distribution header. The VP Instruments VPFlowScope measures mass flow, line pressure, and temperature simultaneously from a single insertion point. Where a suitable tapping point or full-bore ball valve already exists, installation is completed on a live system without cutting the pipe or stopping production. A single technician can commission it in under an hour. The flow reading is the most important number in any compressed air audit: it tells you what the compressor is actually putting into the network, and how that changes across shifts, overnight, and at weekends.
Pressure and temperature at key points. The CS Instruments PTS 500 maps delivery conditions from the compressor outlet to the point of use. The gap between the pressure the compressor delivers and the pressure at the end of the distribution network is not always explained by normal pipe friction. When it is larger than expected, something in the network is absorbing pressure it should not be. Every 1 bar of excess operating pressure the compressor runs at to compensate adds approximately 7% to electricity consumption.
Dew point at the dryer outlet. This is the monitoring point most UAE facilities skip, and it is the one that matters most in summer. Compressor rooms in Dubai and Abu Dhabi regularly exceed 45 degrees Celsius from June to September. Refrigerated dryers that are undersized, have degraded refrigerant, or are working harder than their rated conditions can handle will not always maintain their specified dew point under peak load. The failure is invisible until it shows up as corrosion, instrument damage, or a product quality problem downstream. Continuous dew point monitoring catches it in real time.
Energy at the compressor. The CS Instruments CS PM 5110 panel-mounted energy meter measures true electrical consumption at the compressor. Combined with the flow reading from the VPFlowScope, it gives you kWh per Nm3 of air produced. This single figure, specific power consumption, is the primary efficiency indicator for any compressed air system. A compressor whose specific power is trending upward over weeks and months is telling you something is wrong, whether that is valve wear, filter fouling, or a deteriorating discharge temperature. Spotting it on a dashboard is far cheaper than discovering it on a breakdown call.
What the Data Reveals in Practice
Monitoring data from a real installation is rarely surprising in the way a fault is surprising. It is more often clarifying. The overnight baseline flow is higher than it should be. The pressure at the far end of the network is lower than anyone realised. The dew point spikes every afternoon at the same time. Each of these patterns points to a specific problem with a specific fix.
In a food packaging facility we monitored in Dubai, the overnight baseline flow, measured when all production equipment was switched off, was running at 18% of peak daytime demand. In a well-managed system, overnight baseline should be under 10% of total output. The difference represented air escaping through leaks in the distribution network around the clock. The facility was running a 110 kW fixed-speed compressor at 7,800 hours per year. Once the leaks were located using ultrasonic detection and repaired, the overnight baseline dropped below 4% and annual electricity costs fell by over AED 60,000. The facility team had not measured overnight flow before. The loss had been running for years.
Pressure mapping tells a similar story. In a metal fabrication shop in Sharjah running laser cutters and pneumatic tools on the same ring main, the pressure at the laser cutter connection was consistently 1.2 bar lower than at the compressor outlet during peak shift. The compressor was set to 9 bar to ensure the laser cutter received its minimum required pressure. Once the pressure drop source was identified and corrected, the system ran at 8 bar with the same delivery at every tool. At approximately 7% per bar, that single change saved around 7% of compressed air electricity consumption with no equipment purchase.
Not sure where your compressed air energy is going? CHS can install a monitoring baseline and have results on a live dashboard within days. Book a free site survey, no commitment required.
The Business Case for a UAE Plant
A 10% reduction in compressed air energy consumption for a UAE facility running a 150 kW compressor at 8,000 hours per year saves 120,000 kWh annually. At the DEWA working rate of AED 0.44/kWh (base rate AED 0.38 plus the September 2026 fuel surcharge of AED 0.06), that is AED 52,800 per year from a single compressor. Tariffs in Abu Dhabi and Sharjah differ from Dubai's. For plants running multiple machines, the saving scales accordingly.
AED 52,800+
Estimated annual electricity saving from a 10% reduction in compressed air energy for a 150 kW compressor running 8,000 hours/year at the DEWA working rate of AED 0.44/kWh (AED 0.38 base + AED 0.06 fuel surcharge, September 2026). Source: dewa.gov.ae/en/consumer/billing/slab-tariff, verified 9 September 2026.
The energy saving is the most straightforward part of the case. Add reduced unplanned downtime, a compressor flagged for rising specific power before it trips, a dryer identified as underperforming before it causes downstream instrument damage, and the monitoring investment pays back faster. The cost of a full monitoring installation covering flow, pressure, dew point, and energy is typically recovered from electricity savings within one to two years on a medium-sized UAE production site.
For multi-site operations across Dubai, Sharjah, and Abu Dhabi, central monitoring from a single dashboard gives management visibility over compressed air costs that was previously unavailable without a dedicated engineer on each site. Compressed air costs are invisible in most facility P&Ls beyond the electricity bill. Making them visible, site by site and shift by shift, is the precondition for managing them.
Installing sensors is the first step, not the last. CHS combines CS Instruments and VP Instruments supply and installation with baseline benchmarking, ongoing data review, and a prioritised improvement programme. After the first monitoring period, typically two to four weeks to capture a full operating cycle, we produce a structured findings report ranking loss points by estimated saving. Leak detection, pressure optimisation, and dryer performance appear in that order of priority in most sites. The output that delivers commercial value is the improvement programme the data supports, not the sensors alone.
FAQ: Compressed Air Monitoring for UAE Plants
Do I need to shut down production to install a flow meter?
The VP Instruments VPFlowScope installs through an existing tapping point or full-bore ball valve without cutting the pipe. Where that fitting already exists, installation is completed on a live pressurised system in under an hour with no production interruption. If no suitable tapping point exists, fitting one is a separate job and may require a short shutdown. CHS confirms the site condition before quoting. Pressure and temperature sensors fit to existing tapping points. A full monitoring installation covering flow, pressure, temperature, dew point, and energy can typically be commissioned without stopping production.
How is monitoring data accessed?
CS Instruments' CS Network software collects the readings from every sensor into a database on your own company network. Your team can view them on any number of company computers, with trend graphs and automatic email alarms when a reading goes outside the limits you set. It can also email weekly, monthly and annual consumption reports automatically. For UAE sites running multiple shifts, the right people can see compressed air performance without anyone walking to the compressor room.
What is the minimum configuration that provides useful data?
A single flow meter at the main distribution header paired with a panel-mounted energy meter at the compressor gives you specific energy consumption: kWh per Nm3 of air produced. This one figure is the primary performance indicator for any compressor and the starting point for any optimisation programme. Adding dew point at the dryer outlet and pressure sensors at header and key points of use completes a full baseline. CHS advises on the right starting configuration for your system size and budget as part of a free site survey.
Can CHS monitor systems from other compressor manufacturers?
Yes. CS Instruments and VP Instruments sensors measure the air in your pipework regardless of which brand of compressor produced it. CHS installs monitoring on Hertz equipment and on systems from other manufacturers. For UAE facilities running a mixed fleet, central monitoring from a single dashboard is often the first time management has seen the whole system's performance in one place.
Ready to See Your Compressed Air in Real Time?
CHS supplies, installs, and commissions CS Instruments and VP Instruments monitoring systems across UAE industrial facilities. The starting point is a free site survey to identify the best measurement points and agree a monitoring scope. No commitment required from that first conversation.
If your facility is running compressors without continuous measurement, you are managing on assumption. The data usually reveals more than expected, and the savings that follow are real, measurable, and permanent.
Phone: +971 4 3232 523
Email: info@planetchs.com
Website: planetchs.com/contact-us